> ## Documentation Index
> Fetch the complete documentation index at: https://docs.onsomble.ai/llms.txt
> Use this file to discover all available pages before exploring further.
# Region Exploration
> Compare your measured AI visibility across countries and cities and see how it changes between scans.
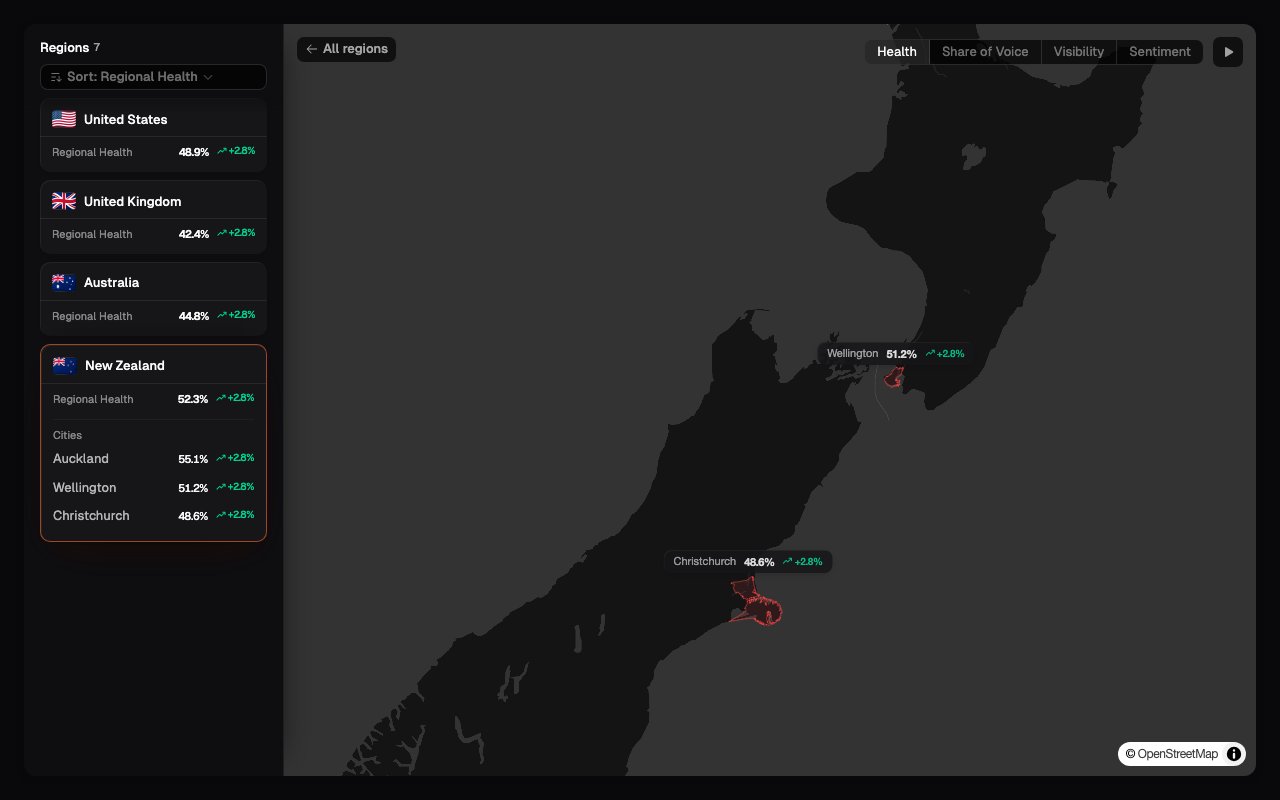
If your prompts cover more than one region, **Region Exploration** appears under Insights. It places your results on a map so you can compare the countries and cities included in your scans.
Use it to answer questions such as: *Is our brand mentioned more often in Australia than New Zealand?* or *Which city has the weakest sentiment?*
 ## Choose what the map measures
Select one of four metrics at the top of the page. The map colours and regional ranking update to show that metric for the selected brand.
These use the same calculations described in [Understanding metrics](/results/understanding-metrics#the-five-headline-metrics), limited to the measured responses for each region.
| Metric | What it means |
| ------------------ | -------------------------------------------------------------------------------------------------------------------------------------------------------------- |
| **Health** | The average of regional Visibility, Share of Voice, and Sentiment. It is a broad summary, so inspect the three component metrics before deciding what changed. |
| **Share of Voice** | Your brand's share of all tracked-brand mentions in responses for that region. |
| **Visibility** | The percentage of eligible responses for that region that mention your brand. |
| **Sentiment** | The average tone of the brand's mentions in that region, on a 0 to 100 scale where 50 is neutral. |
The list beside the map lets you compare the same values without relying on colour alone. Select a country or city to inspect it more closely.
## Understand the geographic scope
A region appears because prompts were measured for that location. It does not represent every place where the business operates, and a blank area does not mean the brand has no presence there.
Country-level results may summarize the measured locations within that country. City-level results are useful for local comparison, but they can be based on fewer responses than the national result.
Compare regions only when they have reasonably similar prompt coverage. A
region can look unusually strong or weak because it was measured with a
different or smaller set of questions.
## Replay earlier scans
When more than one completed scan is available, use the timeline to move between scan dates or play the history in sequence. This shows when a regional score changed.
It does not establish why it changed. Treat the movement as a reason to inspect the prompts and responses for that region, especially when the prompt set or selected models also changed.
## What to look for
* **A region where Visibility is low:** Open its prompt results and see which questions consistently omit the brand.
* **A region with good Visibility but weak Share of Voice:** The brand appears, but competitors account for more of the tracked-brand discussion.
* **A region with positive mentions but low Health:** Check Visibility and Share of Voice; favourable language alone may not offset limited presence.
* **Thin or missing regional data:** Review the [Prompt Library](/scans/prompt-library) before treating it as a performance problem.
Region Exploration only appears when the Site's prompts span more than one
region. For a single-region prompt set, use the region filter on the other
Insights pages.
## What's next
Review which questions and locations provide the regional data.
Narrow another Insights page to a particular region.
## Choose what the map measures
Select one of four metrics at the top of the page. The map colours and regional ranking update to show that metric for the selected brand.
These use the same calculations described in [Understanding metrics](/results/understanding-metrics#the-five-headline-metrics), limited to the measured responses for each region.
| Metric | What it means |
| ------------------ | -------------------------------------------------------------------------------------------------------------------------------------------------------------- |
| **Health** | The average of regional Visibility, Share of Voice, and Sentiment. It is a broad summary, so inspect the three component metrics before deciding what changed. |
| **Share of Voice** | Your brand's share of all tracked-brand mentions in responses for that region. |
| **Visibility** | The percentage of eligible responses for that region that mention your brand. |
| **Sentiment** | The average tone of the brand's mentions in that region, on a 0 to 100 scale where 50 is neutral. |
The list beside the map lets you compare the same values without relying on colour alone. Select a country or city to inspect it more closely.
## Understand the geographic scope
A region appears because prompts were measured for that location. It does not represent every place where the business operates, and a blank area does not mean the brand has no presence there.
Country-level results may summarize the measured locations within that country. City-level results are useful for local comparison, but they can be based on fewer responses than the national result.
Compare regions only when they have reasonably similar prompt coverage. A
region can look unusually strong or weak because it was measured with a
different or smaller set of questions.
## Replay earlier scans
When more than one completed scan is available, use the timeline to move between scan dates or play the history in sequence. This shows when a regional score changed.
It does not establish why it changed. Treat the movement as a reason to inspect the prompts and responses for that region, especially when the prompt set or selected models also changed.
## What to look for
* **A region where Visibility is low:** Open its prompt results and see which questions consistently omit the brand.
* **A region with good Visibility but weak Share of Voice:** The brand appears, but competitors account for more of the tracked-brand discussion.
* **A region with positive mentions but low Health:** Check Visibility and Share of Voice; favourable language alone may not offset limited presence.
* **Thin or missing regional data:** Review the [Prompt Library](/scans/prompt-library) before treating it as a performance problem.
Region Exploration only appears when the Site's prompts span more than one
region. For a single-region prompt set, use the region filter on the other
Insights pages.
## What's next
Review which questions and locations provide the regional data.
Narrow another Insights page to a particular region.