> ## Documentation Index
> Fetch the complete documentation index at: https://docs.onsomble.ai/llms.txt
> Use this file to discover all available pages before exploring further.
# Schedule
> Set how often your AI visibility is measured, and review every past run.
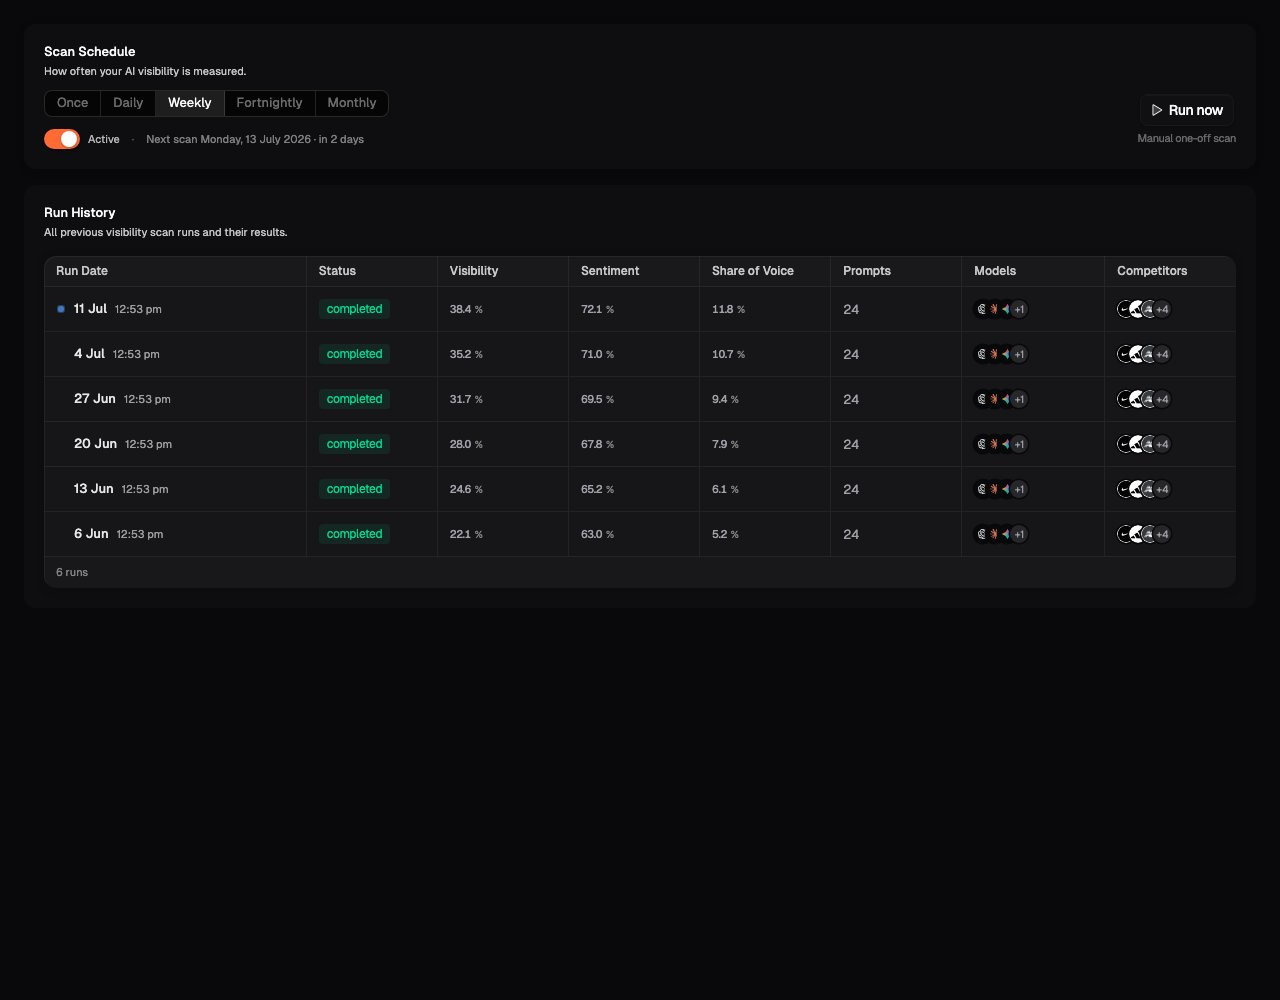
The **Schedule** page, under **Scan Settings**, controls how often scans run automatically, and holds the history of every run the Site has done.
 ## Scan Schedule
Recurring scans are how you turn snapshots into trends. Toggle recurring scans on and pick a cadence:
* **Once**: a single scheduled run
* **Daily**
* **Weekly**
* **Fortnightly**
* **Monthly**
Which cadences are available depends on your plan; options outside your plan point you to **View plans**. See [Plans and entitlements](/account/plans-and-entitlements).
If you're actively publishing content or making discoverability changes, a
faster cadence lets you see the impact quickly. Once things stabilise, step
the cadence down. The trend line matters more than the sampling rate.
## Run History
Below the schedule sits **Run History**: every previous visibility scan run and its results. Each run shows its status and headline outcome, and expanding **Scan details** shows what the run covered:
* **Prompts** and **Models**: the configuration that run used
* **Total cells** and **Cells executed**: how many prompt-model-region combinations the run covered
* The run's cost and its headline metrics
Run History is the place to answer "did that scan actually run?", "what did last month's scan cover?", and "when did we change the configuration?". Agencies reporting to clients on what was measured and when will use it constantly.
## What's next
Where fresh results land after each run.
The trend lines your recurring scans build over time.
## Scan Schedule
Recurring scans are how you turn snapshots into trends. Toggle recurring scans on and pick a cadence:
* **Once**: a single scheduled run
* **Daily**
* **Weekly**
* **Fortnightly**
* **Monthly**
Which cadences are available depends on your plan; options outside your plan point you to **View plans**. See [Plans and entitlements](/account/plans-and-entitlements).
If you're actively publishing content or making discoverability changes, a
faster cadence lets you see the impact quickly. Once things stabilise, step
the cadence down. The trend line matters more than the sampling rate.
## Run History
Below the schedule sits **Run History**: every previous visibility scan run and its results. Each run shows its status and headline outcome, and expanding **Scan details** shows what the run covered:
* **Prompts** and **Models**: the configuration that run used
* **Total cells** and **Cells executed**: how many prompt-model-region combinations the run covered
* The run's cost and its headline metrics
Run History is the place to answer "did that scan actually run?", "what did last month's scan cover?", and "when did we change the configuration?". Agencies reporting to clients on what was measured and when will use it constantly.
## What's next
Where fresh results land after each run.
The trend lines your recurring scans build over time.